
Sidebar
Using the NIST Spectrum Digitizer Program
Written by Meng Zhai
Chemical and Biochemical Reference Data Division
National Institute of Standards and Technology (NIST), Gaithersburg, Maryland
For inquiries regarding this program please contact Dr. David Sparkman at ods@csi.com.
Download the program here (1/8/2010).
The following is a tutorial on how to digitize a mass spectrum using the NIST Mass Spectrum Digitizer Program. These are step-by-step instructions on how to go from a graphic image to an .msp file containing the desired information. The NIST MS Search Program can then import the .msp file.
This program requires that Oracle’s Java be installed (https://java.com/en/). Click on the Free Java Download button.
Some Important Information:
Oracle’s Java is already installed on many computers. Download the NIST Spectrum Digitizer Program. This file (SpectrumProgram.jar) will be in the \Download folder. When the Mouse pointer is put on the Program’s name and the left Mouse button is double-clicked, the Program will run, if Java is installed. If the Program causes a dialog box to be opened that ask for an association, it will be necessary to first download and install Java. After Java has been installed, try to run the Digitizing Program again.
There is no installation and no icon is created for the Digitizing Program. For convenience, it may be desirable to move the Program to the folder containing the NIST Library, e.g., \NIST17. It may also be convenient to create a Desktop icon, but the Digitizing Program can always be started from Windows Explorer by putting the Mouse pointer on the name and double-clicking the left Mouse button.
When a graphic spectrum is imported it may include numeric labels on the X-axis (abscissa) and the Y axis (ordinate) and the tops of some of the peaks. The spectrum may have a graphic representation of a structure. None of these annotations are taken into consideration by the Program in the digitizing process.
When a graphic spectrum is displayed in the Program, it cannot be Closed. Opening a new graphic display will replace the existing display, clear the Points List (lower part of the Vertical Information Column on the right side of the Program’s desktop), the X Calibration Points List, and any zoom from the previous display. The spectrum information fields (text boxes at the top of the display) are not cleared when a new spectrum is displayed. It is necessary to put the Mouse pointer on the Clear button (one of four buttons on the left side of the top of the desktop, in line with the text boxes) and click the left Mouse button to clear these fields. The Date: and Digitizer: fields will not be cleared when the Clear button is selected. The Date: field updates automatically. Whatever is in the Digitizer: field remains until changed, even when the Program is closed and re-opened.
The Y0: and Y1: fields ARE CLEARED when a new graphics display is opened. The Left and Right positions and the Threshold positions ARE NOT CLEARED. It is best to reset these three positions for each new graphic.
When the Digitizing Program is closed by putting the Mouse button on the X button at the far upper right of the desktop and clicking the left Mouse button, all data is removed. When the Program is started at a later time, the previous data and information will be gone. Only the Date: and Digitizer: fields will be populated. The default File Open dialog box and the default File Save dialog box will point to the folders last used before the Program was last closed.
When the Mouse pointer is placed on the upper Reset button (previously, the Done button) in the upper part of the Vertical Information Column on the right side of the Program’s desktop, and the left Mouse button is clicked, all the values in the X Calibration Points List will be cleared and all the Digitized m/z – intensity Pairs List will be cleared. The affected zoom will remain. The values for Y0, Y1, Left, Right, and Threshold will be retained. The label on this Reset button returns to Done.
When the Mouse Pointer is placed on the lower Reset button (previously, the Set Points button) and the left Mouse button is clicked, only the Digitized m/z value-intensity Pairs are deleted. The label on this button then returns to Set Points. The Y0 and Y1 values, Left, Right, and Threshold values and the X Calibration Points are not cleared. It is now possible to alter these various parameters to achieve a better digitization.

Figure 1. The NIST Mass Spectrum Digitizer Program Desktop. The vertical red line is used to fix the position of the X points and the Left and Right Boundaries which are indicated by the two vertical-green lines on either side of the spectrum. The horizontal red line is used to fix the Y0 (base line of the mass spectrum) and Y1 (maximum intensity) points and the Threshold, which is indicated by the horizontal turquoise line.
Obtaining the data
The Program will always open with no data loaded. A blank desktop.
- Opening a spectrum
- Put the Mouse Pointer on the Open button on the top left of the Program’s desktop and click the left Mouse button. This opens the File Open dialog box. The default location is the last folder used before closing the Program or when selecting a previous graphic. Navigate this dialog box in the same way any File dialog box is navigated. Once the folder containing the graphic file of the spectrum has been located, Highlight the folder’s name, put the Mouse pointer on the Open button, and click the left Mouse button.
- Find the desired file, Highlight its name. Only images of the supported file types (.jpg, .bmp, .gif, and .png) may be selected.
- Put the Mouse pointer on the Open button in the File Open dialog box and click the left Mouse button. The image will appear on the Program’s desktop.
- Resizing the image
- After an image is opened and displayed, it is possible to put the Mouse pointer on the + or – buttons under the button labeled Unzoom in the Vertical Information Column, to increase or decrease the size of the image by clicking the left Mouse button. Small increments in both the x- an y directions are achieved for each click. Click on the Unzoom button to set the image to its original size.
- After the desired size of the image is achieved, put the Mouse pointer on the Done button and click the left Mouse button to continue. This button will now be labeled Reset. All the buttons in the Vertical Information Column that were previously grayed and unavailable are not available. The Unzoom and + and – buttons are now grayed.
- If the zoom of the image needs to be changed, put the Mouse pointer on the Reset button (originally labeled the Done button) and click the left Mouse button. This will make the + or – buttons available and the Reset button’s label will change back to Done. The image WILL NOT be returned to its original size. It will remain its present side until resized with the + or – buttons or the Unzoom button is selected. This will also delete any X Calibration Points and any Digitized m/z value-intensity Pairs.
- Adding X calibration values
It is necessary to provide the Program with calibration points for the x-axis. As the Mouse pointer is moved over the surface of the display, a vertical and horizontal red line will change locations. It is best to set the X Calibration Points before setting the Y Calibration Points.- There is a button on the left of the Vertical Information Column on the Program’s right side labeled Set X. Put the Mouse pointer on this button and click the left Mouse button. This button will be grayed until the Done button has been selected and is labeled Reset. Once the Set X button has been selected, Set X will appear at the top of the Vertical Information Column.
- The red cross-hairs will follow the Mouse pointer as it is moved over the image. Move the Mouse until the vertical red line is lined up with an X value that is a known m/z value in the spectrum. As the Mouse pointer is moved, the value in the box next to the Image X: label will change. Click the left Mouse button to lock the value. After clicking the left Mouse button, the value in the Image X: box will not change. This is the pixel value of the X value that has been selected.
- Once the pixel value for X is set, the textbox next to the Real X: label is highlighted. This is where the m/z-value for X should be typed. After typing the m/z value, press the Enter key on the keyboard or put the Mouse pointer on the Add button and click the left Mouse button. Either action will result in the pixel-m/z value pair being added to X Calibration Points List. Once a pixel value is locked, it is necessary to set a value for Real X:. Another pixel value cannot be set without setting a corresponding value for Real X:.
- If an error was made in selecting the pixel value, just enter an m/z value and delete the pair later.
- As many X calibration pixel-m/z value pairs as desired can be added; however, at least two calibration pairs are required. Calibration points are always added to the list in the format: pixel value followed by the m/z value.
- The program automatically waits for the next pixel value to be selected by positioning the vertical red line and clicking the left Mouse button. Repeat steps a)-e) until the desired number of X calibration values have been selected. X calibration values appear in increasing pixel-m/z values from top to bottom.
- If at any time it is necessary to add more X calibration values, put the Mouse pointer on the Set X button and click the left Mouse button. Then start at step a).
- If the Set Points button has been selected and its label has changed to Reset, the Set X and Add buttons will be grayed and unavailable. To add new X calibration points, it will be necessary to put the Mouse pointer on this lower Reset button and click the left Mouse button. After the new X calibration point has been added, it will be necessary to use the Set Points button to get a revised digitized spectrum.
- Deleting X calibration values
- X calibration points can be deleted. If a series of X calibration points have just been added, they will appear grayed in the list. If the number of calibration points exceeds the size of the box, a scroll bar will appear on the right of the box.
Before the X calibration points can be deleted, they must be un grayed. This may require putting the Mouse pointer on the Set Y0 button and clicking the left Mouse button. This is a known bug.
Highlight the values to be deleted and then put the Mouse pointer on the Delete button (located just under the list) and click the left Mouse button. (Select multiple values by using the Shift and Ctrl keys on the Keyboard.) - After selecting the points to be deleted, put the Mouse pointer on the Delete button and click the left Mouse button. Remember, at least two X calibration points are needed to proceed.
- Calibrating Y0
There are no graphic indications of the Y0 and Y1 values, just as there are no graphic indications as to the position of the X Calibration Points.- The Y values will need to be calibrated by setting two points, the minimum and the maximum peak intensity. To set the minimum, put the Mouse pointer on the Set Y0 button and click the left Mouse button.
- The textbox at the top of the Vertical Information Column should now read Set Y0.
- Move the Mouse until the horizontal red line is aligned with the X axis (where Y is 0 is), and click the left Mouse button to set that value.
- The text value in the box next to the Image Y0: label will change as the Mouse is moved. This is the pixel value of the selected Y0 value and is locked when the left Mouse button is clicked. The value in the box next to the Real Y0: label is set to 0 by default, and it is recommended that this value not be changed.
- Calibrating Y1
- The maximum Y1 value needs to be set. Put the Mouse pointer on the Set Y1 button and click the left Mouse button.
- The textbox at the top right corner should read Set Y1.
- Move the Mouse until the horizontal red line is aligned with the top of the most intense peak on the spectrum (the maximum Y value), and click the left Mouse button to lock this value.
- The box next to the Image Y1: label will contain the pixel value for Y1. This is the pixel value for Y value selected. The box next to the Real Y1: label value is set to 9999 by default, and it is recommended that this value not be changed.
- Setting the boundaries and getting the data
- The boundaries (lowest and highest m/z values that an intensity can be observed in the digitized spectrum) of the spectrum will need to be set. Put the Mouse pointer on the button labeled Left (lower part of the Vertical Information Column) and click the left Mouse button.
- The textbox at the top right corner should read Set Left Bound. When the Right button is selected to set the right boundary, the text in this box should change accordingly.
- Move the Mouse until the vertical red line is where the left boundary should be, and click the left Mouse button to set the boundary. The program will not get any data to the left of this line (a green vertical line on the left side of the display).
- A right boundary will also need to be set. Put the Mouse pointer on the Right button and click the left Mouse button.
- Move the Mouse until the vertical red line is where the right boundary should be, and click the left Mouse button to set the boundary. The program will not get any data to the right of this line (a green vertical line on the right side of the display).
- An X threshold value will need to be set. The program will not get any data that has peaks below this line (a vertical turquoise colored line). Put the Mouse pointer on the Threshold button and click the left Mouse button. The top of the Vertical Information Column will read Set Threshold.
- Move the Mouse until the horizontal red line is where the threshold line should be, and click the left Mouse button to set the threshold. Make sure the line goes through all the peaks to be included in the digitized spectrum and above any peaks that are to be excluded because the program will not save any data that has peaks below this line.
- When all three boundaries have been set and all calibration values are correct, put the Mouse pointer on the Set Points button and click the left Mouse button to get the digitized data. The label on the Set Points button changes to Reset. Placing the Mouse pointer on this lower Reset button and clicking the left Mouse button results in all the digitized points being deleted. The Y0, Y1, Left, Right, and Threshold values remain. They can be changed. When this Reset button is selected, the label on the button changes back to Set Points. The X Calibration Points are unaffected by the selection of this Reset button.
- Viewing the data
- After putting the Mouse pointer on the Set Points button and clicking the left Mouse button, if there has been no errors, a list of all the data points of real values, in the x (m/z value),y (relative intensity based on a scale of 10,000) format will appear in the list in the Digitized m/z-intensity Pairs List in the Vertical Information Column. Alternating pink and green squares (points) should also be shown on the top of each peak in the graphic spectrum image. Each of the points drawn corresponds to a pair in the list.
Manually manipulating the data
- Moving points
- Put the Mouse pointer a data point in the Digitized m/z-intensity Pairs List and click the left Mouse button to select it. Then, use the arrow keys on the keyboard to change the values (Left and Right arrows to reduce or increases the m/z value, Up and Down arrows to increase or decrease the intensity).
- Alternatively, put the Mouse pointer on the point in the spectrum image that is to be changed, and drag the Mouse pointer while holding down the left Mouse button to move the point.
- The point that is being moved will change coordinates in the list as it is moved. Several clicks of the Up and Down arrows will be required to change an integer m/z value.
- Adding points
- Put the Mouse pointer on the Add button and click the left Mouse button.
- Put the Mouse pointer on the spectrum image where the point is to be added and click on the left Mouse button. When the point is first added, it will be represented on the graphic display of the spectrum by a slightly larger point than those set by the Program. This new point will be colored dark-blue.
- The new point should appear in the list in the correct, sorted-position with the appropriate intensity.
- The Add button must be selected for each and every point that is to be added. When the Add button is selected again, the just added point will be smaller and represented by the alternate green and pink colors used for the other points.
- Deleting points
- Put the Mouse pointer on the Delete button and click the left Mouse button.
- Put the Mouse pointer on the point to be delete on the graphic display of the spectrum to be deleted and click the left Mouse button. The point will be slightly large and its color will be dark-blue.
- The point selected should also be highlighted in the list.
- Alternatively, put the Mouse pointer on the point to be deleted in the Digitized m/z-intensity Pairs List and click the left Mouse button on the data point in the list.
- Then put the Mouse pointer on the Delete button and click the left Mouse button and the point is deleted.
Exporting the data
Information about the molecule/spectrum can be entered in textboxes at the top of the Program’s display. Put the Mouse pointer in the box where information is to be added and click the left Mouse button. Type the desired information. Press the Enter key or move the Mouse pointer to another box. It is best to use the Clear button to clear these fields before starting to add new data.
- Entering identification information
- Name: Name of the molecule.
- Formula: The molecular formula (elemental composition) of the molecule.
- MW: The molecular weight (nominal mass) of the molecule.
- Contributor: The author, title, volume/issue, pages, etc. of the journal article that had the spectrum, or the source of the spectrum.
- CASNO: The unique CAS (Chemical Abstracts Service) registry number assigned to this molecule.
- Date: The date this spectrum is digitized (will appear automatically).
- Digitizer: The user who digitized this spectrum (should appear automatically).
- Saving as a .msp file
- Put the Mouse pointer on the Save button and click the left Mouse button. This opens a File Save dialog box.
- Find the folder to which the .msp file is to be saved (Usually the default folder for the NIST MS Search Program, C:\NIST17\MSSearch\). Type the name the .msp file is to be saved as. The .msp extension will be added automatically.
- Put the Mouse pointer on the Save button in the File Save dialog box and click the left Mouse button.
- If a preexisting file is selected, the option of overwriting or appending the file is offered.
- .msp is the default format of the data accessed by the NIST Mass Spectral Search Program.
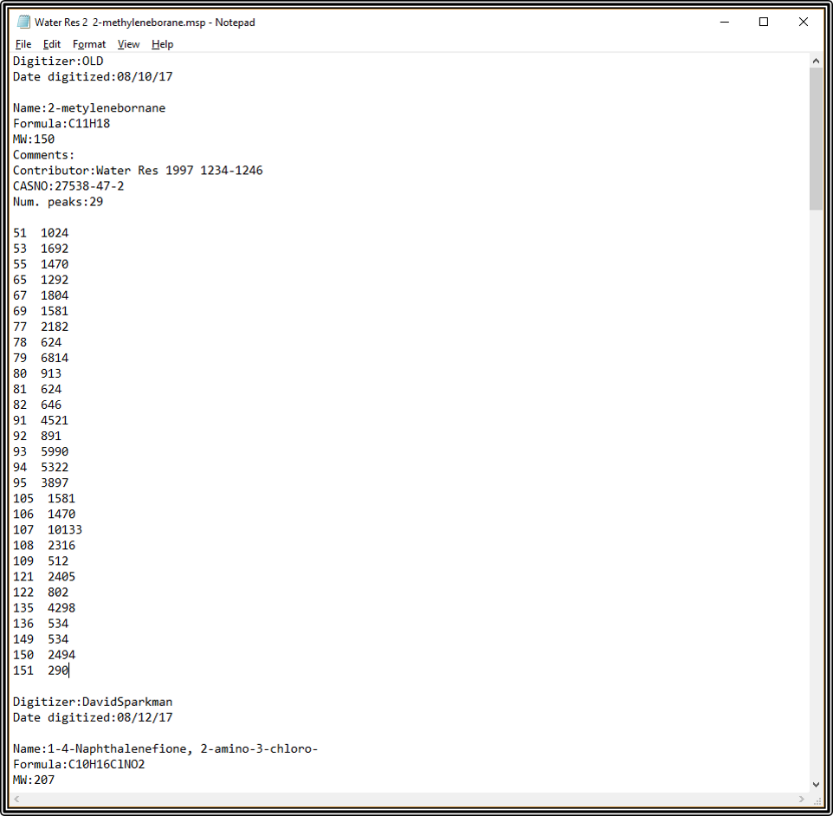
- The first line of an .msp file starts with Name:. Three lines above this is Digitizer: with the information from that field in the Digitizer Program. The next line contains Date digitized: with the information from that field in the Digitizer Program. This is followed by a blank line. These three lines are ignored when the .msp spectrum is imported into MS Search. There is a blank line between the last of m/z value intensity pair of a spectrum and the start of the next spectrum. The first line of the next spectrum will have the header Digitizer:.
To view the contents of the .msp file, open it with Notepad.
Using keyboard shortcut keys
![]() Note: Shortcut keys can only be used if a textbox is not selected. To deselect, click anywhere on the image or the black space.
Note: Shortcut keys can only be used if a textbox is not selected. To deselect, click anywhere on the image or the black space.
- Shortcuts available at all times
- - (Minus sign) - Zoom out
- + (Plus sign) - Zoom in
- 0 - Unzoom
- Space-bar - Done
- Shortcuts available when zooming
- - (Minus sign) - Zoom out
- + (Plus sign) - Zoom in
- 0 - Unzoom
- Space-bar - Done
- Shortcuts available when calibrating
- O - Reset to zoom
- S - Set X
- A - Add (the Enter key can also be used)
- W - Highlight Real X textbox
- Ctrl & Shift - Select multiple calibration points
- D - Delete selected calibration points
- F - Set Y0
- G - Highlight Real Y0 textbox
- R - Set Y1
- T - Highlight Real Y1 textbox
- Z - Left
- C - Right
- X - Threshold
- Space-bar - Set Points
- Shortcuts available when manipulating points
- O - Reset to zoom
- P - Reset to calibration
- Page Up - Select previous point on list
- Page Down - Select next point on list
- Ctrl & Shift - Select multiple data points
- Insert - Add
- Delete - Delete
- Left, Right, Up and Down Arrows - Move a data point
Possible errors
Spectrum Digitizer Program will warn about error with pop-up window similar to this:
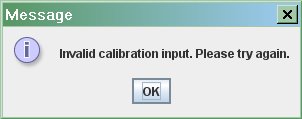
Description of possible errors is following.
1. Invalid calibration input.
An integer for one of the calibration inputs (Image/Real X, Y0, Y1) was not entered. No decimals, letters, other characters, etc. are allowed.
2. Boundaries out of bounds.
One of the boundary lines is out of bounds. One of the following is happening:
- The left bound is farther left than the left side of the image.
- The right bound is farther right than the right side of the image.
- The left bound is to the right of the right bound. (The right bound is to the left of the left bound.)
- The threshold line is below the image.
- The threshold line is above the image.
3. At least two X values required.
As many X calibration values as wanted can be entered, but there needs to be at least two unique ones.
4. Calibration points repeated.
There cannot be repeated calibration points. At least two unique calibration values for X must be entered.
5. Please remove duplicate.
The final list of x, y values that is save is not allowed to have pairs that share the same X value. Delete or change the duplicate pairs at the X value shown.